Nobody is conscripted
Participation is opt-in by jurisdiction and confirmed by local vote. No county is billed for a corridor it did not choose.
Proposal 002 · Regional transit · Treasure Valley, Idaho
You cannot pave your way out of this.
The valley added roughly 150,000 people in six years and is already $193 million a year short of paying for the roads it has. This is a three-phase rail spine along a corridor the region already owns — mapped here on real street data, priced honestly, with every assumption you can move yourself.
The proposition
Adding one lane each way to 2.8 miles of I-84 through Nampa cost about $150 million — roughly $54 million a mile — and the Idaho Transportation Department is planning $300–400 million more in the same corridor. That is not a fix. It is a subscription.
Rail is a build-once asset. This proposal puts a phased, majority-elevated spine in a right-of-way the public already holds, funds it opt-in jurisdiction by jurisdiction, and sunsets every tax instrument that pays for it.
Participation is opt-in by jurisdiction and confirmed by local vote. No county is billed for a corridor it did not choose.
All tax-based instruments carry hard sunset clauses and repayment schedules — 10 to 15 years maximum per issue.
Phase I must clear 70% on-time ridership, 40% cost recovery, and 90% rider satisfaction before Phase II proceeds.
Every contract published pre-award and post-award, every expenditure on a public dashboard, every promise tracked against its outcome.
01 · The pressure
The region's own planning body reports that the Treasure Valley is $193 million short every single year of meeting its transportation needs through 2050. Its words: important regional projects sit on the shelf for lack of money.
Fact Ada and Canyon Counties added roughly 150,000 people in six years, reaching 876,760 in 2026, up from 726,072 at the 2020 Census — the fastest-growing mid-sized metro in the country. COMPASS projects nearly 1.1 million people by 2050 and an 86% increase in regional jobs by 2040.
Fact The I-84 segment through Nampa already carries close to 100,000 vehicles a day. ITD's own engineers project that if nothing structural changes, peak travel times nearly double by 2055 — the peak hour becomes the peak hours.
The mechanism A lane gets congested. The state widens it. The wider road induces more driving until it fills back up. The state widens it again. Every cycle moves public money to the same contractors for a problem that is never permitted to be solved. Nampa cost about $54 million per mile just to add one lane each way, and ITD is already planning $300–400 million more.
Explainer 01
Why the road never catches up, and why a build-once asset does not have to.
Loading the comparison…
Explainer 02
Population the roads have to carry, against the money the region says it does not have.
Loading the growth figures…
02 · Where the line would go
Trunk lines run within or adjacent to the I-84 corridor, using existing transportation rights-of-way and pre-cleared public easements. That is the whole siting thesis: no new scar across the valley, minimal land acquisition, and no eminent-domain fight where one can be avoided.
The guideway runs in the I-84 median. That one architectural decision determines the station set, because a median platform can only be reached where the freeway is already crossed — at an interchange. So the stations here are not a matter of taste. They are the real, numbered exits, pulled from the highway's own ramp data, with the cross street each one carries.
Which exits become stations was decided by counting people, not by opinion: 2020 Census block population inside each interchange's half-mile walk catchment, plus the two-mile drive catchment a park-and-ride actually intercepts. Downtown Boise is the one station that is not an interchange — it is the terminus of the I-184 Connector, which is how a median alignment reaches a downtown sitting three miles north of the mainline.
Explainer 03
Pan and zoom the real street network. Switch phases to see what each one reaches, and switch lenses to put cost, land value, or congestion on the same geography.
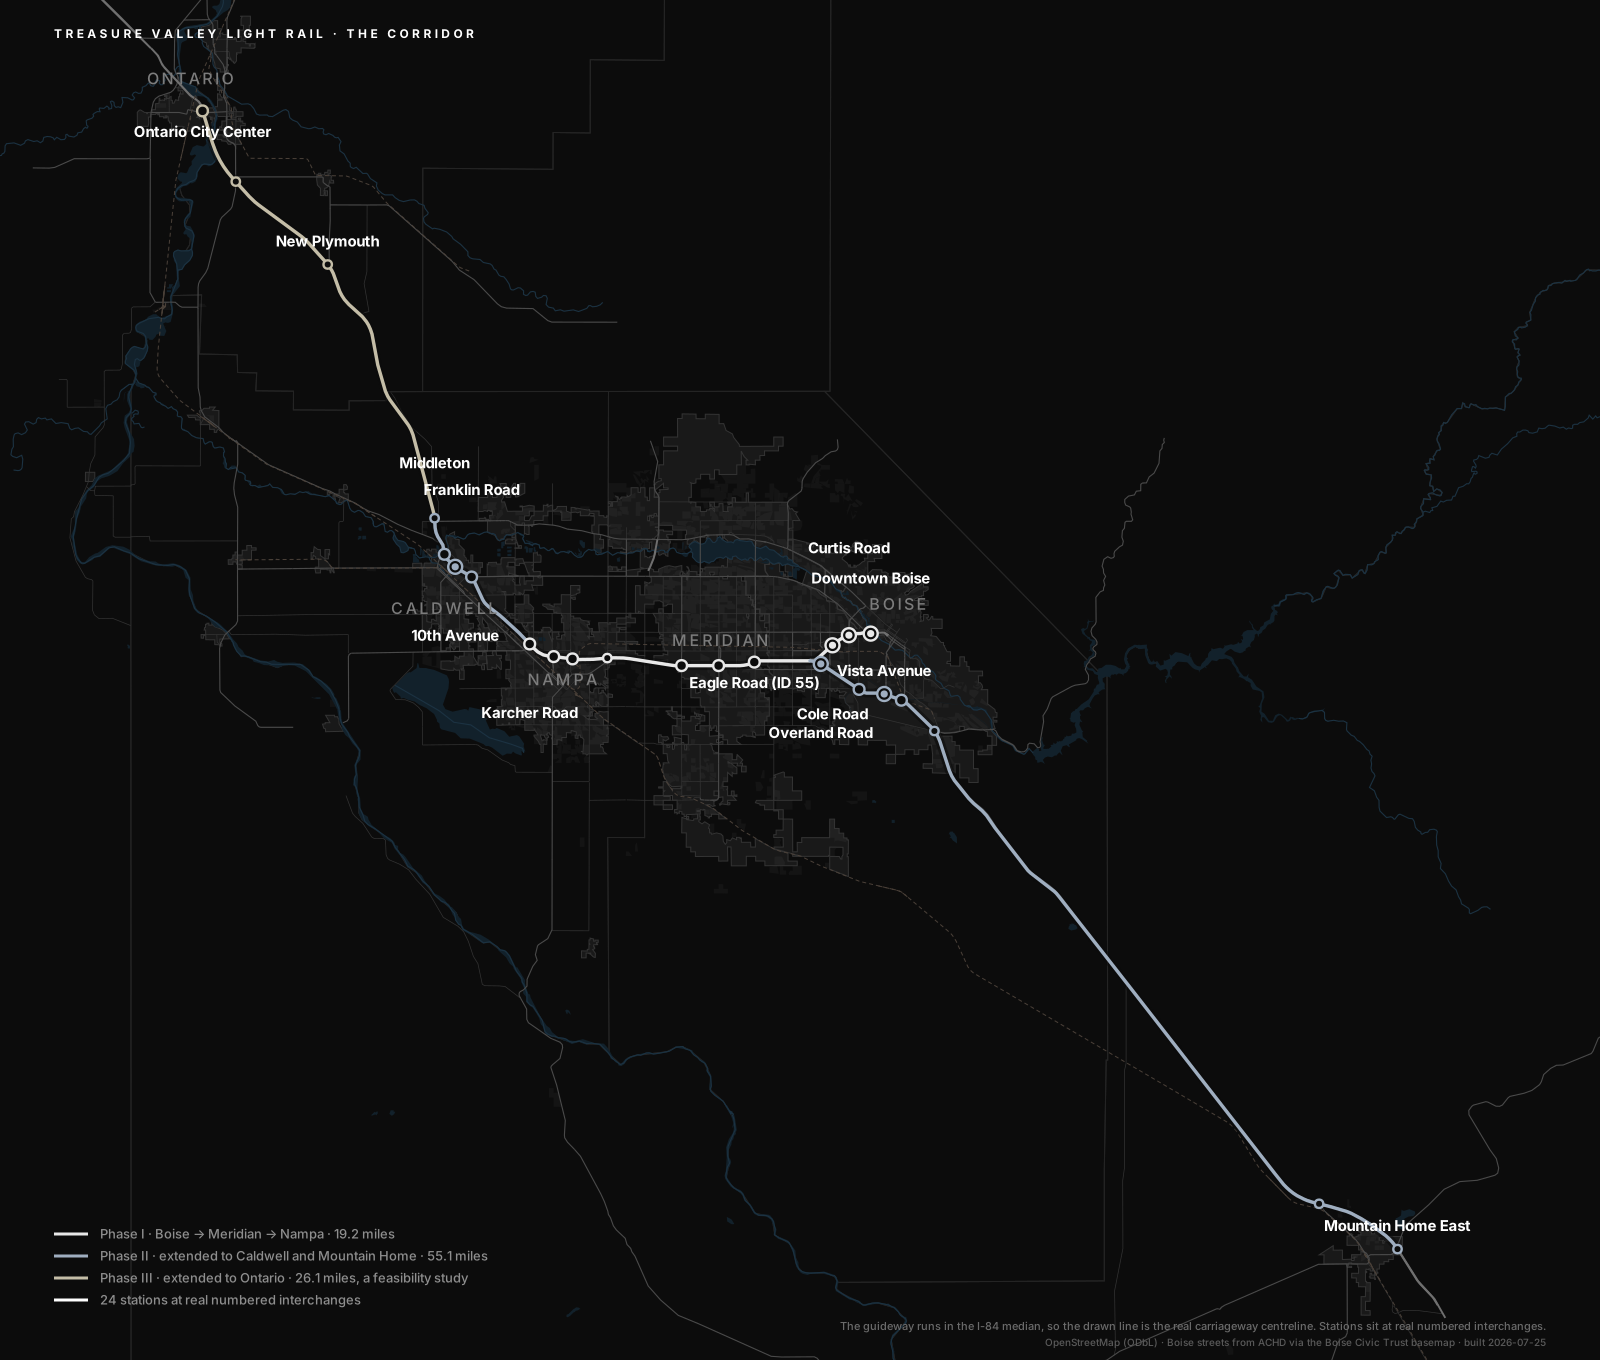
Loading the interactive map…
Interstate, state-highway, arterial, rail, municipal-boundary, hydrography, and land-cover geometry from OpenStreetMap, © OpenStreetMap contributors, ODbL.
The Boise city limit, the Boise River, and the Boise arterial grid are reused directly from the Boise Civic Trust basemap, which derives its road network from Ada County street centrelines published by ACHD — the public road authority for Ada County — reconciled against the statewide Idaho NG9-1-1 centreline dataset. That dataset was not rebuilt for this map.
I-84 is a divided highway, so each carriageway is a separate one-way chain and stitching both together closes a loop at every interchange. The build splits ways by bearing against the corridor axis and assembles one continuous 114.8-mile southeast-bound carriageway, from Ontario, Oregon to the far side of Mountain Home.
Each station sits at a real numbered interchange, recovered from the ramp network and named from that exit's own destination signing, plus the real I-184 terminus in downtown Boise. Tier follows measured demand: a station with 1,500 or more residents within a half-mile walk is Tier 1, one with 15,000 within a two-mile drive is Tier 2, and the rest are park-and-ride.
The half-mile catchment area is exact geometry, and the people inside it are counted rather than modelled: 2020 Census blocks, summed by their internal points. Land use is the weak layer — OpenStreetMap land-use polygons thin out over both dense cores and new growth, which is why they scored Ten Mile Road, one of the fastest-growing interchanges in the valley, at zero developed acres. They are used only as a jobs proxy, never as the population.
Official and open geometry, exactly reproducible · high confidence for what is drawn. The base map is existing public infrastructure. The guideway is the real I-84 and I-184 carriageway centreline, because running in the median means the road geometry is the guideway geometry — it is a measurement, not a proposed alignment drawn by hand.
Corridor data built: July 24, 2026 from public GIS retrieved July 2026.
Download the print map (SVG) · corridor.json · alignment.json · measurements.json03 · Checking the mileage
The proposal states ~26 miles for Boise → Meridian → Nampa. Measured independently along the real median geometry, from the downtown terminus to the mainline junction and west to Nampa, Phase I comes out at 19.2 — and the stated figure is what the same geometry reads when the count runs on across Boise to Gowen Road, track the Mountain Home extension builds.
Measured Phase I is 3.8 miles on the I-184 median, from the downtown Boise terminus to the junction where the spur meets I-84, plus 15.4 miles on the I-84 median west to Nampa: 19.2 miles in total, derived from carriageway centrelines and junction geometry rather than taken from the document. Carry the same measurement southeast from the junction to Gowen Road — 7.9 miles that §2.4 assigns to the Phase II Mountain Home extension — and it reads 27.1, within 4% of the stated ~26.
Why the spur matters Downtown Boise sits 3.2 miles north of I-84, so a median alignment cannot reach it from the mainline — it needs the I-184 Connector. The spur the architecture requires is why Phase I is measured from the downtown terminus, not from the interchange where the two roads meet.
Explainer 04
Every distance measured from public GIS by the build that drew the map.
Loading the corridor measurements…
04 · Who would ride it
Ridership is where transit proposals go to lose their credibility. A number appears, nobody can say where it came from, and the whole document inherits its weakness. This one states no ridership figure at all — it makes ridership a Phase I performance gate. That is the right call, and it leaves a reader with a fair question: how many people would actually ride this?
Stated Phase I must clear 70% on-time ridership, 40% cost recovery, and 90% rider satisfaction before Phase II proceeds. Ridership is a gate the line has to pass, not a promise made before it opens.
Measured, then carried across The answer here is not asserted. Every station's catchment was counted from 2020 Census blocks — the people within a half-mile walk, and the people in the ring out to two miles. Then the same measurement was run against a railway that already exists: Utah Transit Authority rail, whose stations publish their real average weekday boardings. The rate at which people near a UTA station board is fitted from those stations, and applied here.
Why Utah FrontRunner is a single regional line running beside an interstate between separate cities, reached mostly by car, in an auto-oriented Intermountain West valley. That is not a loose analogy — it is the same architecture as Phase I. TRAX, the mature three-line network in the same valley, is what the corridor could grow into rather than what it opens as, and you can switch the comparison to it on the map above.
Explainer 05
Filled dots are stations that exist, with the people around them and the riders they actually get. Open markers are the proposed stations, placed by their own measured population.
Loading the ridership calibration…
Boardings = walk rate × residents within half a mile + ring rate × residents between half a mile and two miles. Two terms, no intercept, both rates held non-negative. No intercept means a station with nobody near it forecasts nobody — which is the correct answer for a rural park-and-ride, and the reason the Middleton and Mountain Home figures are as small as they are.
UTA rail stations are fed by a bus network and by transfers between rail lines. A corridor opening as a single line has neither. The peer relationship is an upper bound on day one, and the Share of the peer relationship control on the map exists so you can say so in numbers.
The population is 2020 Census. The valley has added roughly 150,000 people since, much of it around exactly these interchanges, so the forecast is measured against a valley that no longer exists — the smaller one.
Model, not finding · moderate confidence. The relationship it rests on is real and published; carrying a relationship between metros is the assumption, and it is the assumption you should attack first.
05 · What it costs
Grade separation is the functional thesis: an elevated guideway keeps trains out of the congestion the system exists to bypass, so the line never inherits the traffic it was built to relieve. Elevation costs more. Pretending otherwise is how a proposal loses a technical reviewer.
Fact A viaduct guideway runs roughly $150–250 million per mile against $15–25 million per mile for at-grade track in the same corridor. Recent U.S. light rail averages about $202 million per mile.
Stated A majority-elevated 26-mile spine therefore lands at $3.5–5.5 billion, midpoint about $4.5 billion — not the roughly $1.4 billion a surface line would cost.
The failure mode, named Honolulu's fully-elevated rail reached about $525 million per mile — driven by change orders and consultant churn, not by the physics of elevation. Sacramento built a 100%-elevated extension at below the national median cost per mile. The difference is management, not geography, which is why open contracting is a cost strategy here and not only an ethics one.
Explainer 06
Where a majority-elevated Treasure Valley spine sits among systems that have actually been built.
Loading the cost benchmarks…
Viaduct and at-grade construction costs and the U.S. light-rail average from Manhattan Institute and Buildermuse (2026).
Sacramento and Honolulu per-mile outcomes from the FTA Capital Costs Database via the Eno Center for Transportation.
Comparables are sourced facts; the Phase I band is a stated planning estimate. No engineering study has been performed for this corridor, and the page does not pretend one has.
06 · Who pays
At about $4.5 billion, Phase I is unambiguously a federal New Starts project — and no jurisdiction is billed for a corridor it did not vote to join.
Fact The Capital Investment Grants ceiling is 60% federal for New Starts and 80% for Small Starts and Core Capacity. Utah's FrontRunner double-track project carries a 69.5% federal share, so a 55% assumption here is conservative rather than optimistic.
Opt-in, and it sunsets Municipalities and counties choose whether to participate, through bonds, sales-tax overlays, or Local Improvement District assessments. Every tax instrument carries a hard sunset clause — 10 to 15 years maximum per issue. Federal dollars disburse against progress benchmarks, not up front.
Explainer 07
The capital stack, then the spend allocation inside it.
Loading the funding breakdown…
07 · Value capture and LIDs
A transit line raises the value of every parcel near a station. Under a private-toll model a concessionaire captures that. Under this proposal a Local Improvement District routes it back into retiring the system's own debt — opt-in, assessed only on the parcels that benefit, and sunset when the debt is paid.
Fact A joint APTA and National Association of Realtors study across seven metros, including Phoenix, found residential property within a half-mile of fixed transit sold for 4–24% more, and commercial property for 5–42% more per square foot.
Stated The proposal projects 8–17% uplift inside the half-mile catchments, and a total taxable-value roll-up of $2.1–3.4 billion. It labels that roll-up a target and says plainly it "cannot be certified until the actual parcel base in each station zone is modeled."
The five hub catchments the proposal actually names total 2,515 acres, about 3.9 square miles, measured on real geometry. To produce $2.1–3.4 billion of uplift at the stated 8–17%, the assessed base inside those catchments would have to be $12.4–42.5 billion — between $4.9 and $16.9 million for every acre, including the Mountain Home catchment this build measures as 92% undeveloped. Ada County's 2026 median single-family home is $530,000; at a typical four-units-per-acre detached density that is about $2.1 million per developed acre.
Either the roll-up assumes many more stations than the five hubs named, or a catchment wider than the half-mile the proposal defines, or a parcel base far above Treasure Valley norms. The proposal should state which, or restate the figure. Nothing else in the funding architecture depends on it — the capital plan is carried by the federal share, local opt-in contributions, and PPP capital, not by value capture. But a number that is off by roughly a factor of five is the first thing a hostile reviewer will find, so it should be corrected before they do.
Explainer 08
The same surplus, under two ownership models.
Loading the value-flow comparison…
Explainer 09
Switch the map above to the Value capture lens to draw the half-mile catchments and move these inputs. Every figure recomputes as you drag.
The calculator lives in the map — select Value capture in Explainer 03 to open it, or read the reconciliation above for the finding it produces at the default inputs.
APTA / National Association of Realtors (2019), seven metros including Phoenix. The slider is bounded by the residential range so it cannot be set outside the evidence.
Defaulted from Ada County's 2026 median single-family value at a typical detached density. This is the single input that most needs replacing with the county assessor's parcel roll before any LID is formed. It is exposed here precisely so it can be argued with.
Exact: a half-mile circle is 503 acres, and there are 24 stations. The residential base is not a developed-share guess — it is the real 2020 Census housing-unit count inside those catchments, counted block by block. Only the price per home and the price per commercial acre are assumptions.
Model, not finding · low confidence pending assessor data. The reconciliation gap above is a high-confidence result: it holds across the whole plausible range of the inputs.
08 · The law we change
Idaho Code § 40-2109(1) says only one regional public transportation authority may exist per county, with exclusive jurisdiction over publicly funded transit. Read literally, it would force this system to fold under the existing authority and disappear as a distinct structure.
The statute already contemplates this Idaho Code § 40-2105 authorises not only county-wide authorities but regional authorities spanning contiguous parts of one or more counties. The legal chassis exists; only the exclusivity clause needs modernising.
The rule is already honoured in the breach Ada County today runs the Ada County Highway District — statutorily empowered to operate park-and-ride and rideshare programmes — right alongside Valley Regional Transit. Two transportation authorities, one county, functioning concurrently. The claim that exactly one may exist is a political convention the region already violates, not a law of nature.
It is a 2004 artefact The exclusivity language was added by Senate Bill 1269 (2004), a bill titled "relating to intracity light rail systems" — drafted for a single city, before the valley became the fastest-growing mid-sized metro in the country. Modernising a twenty-year-old provision is ordinary legislative maintenance, not a radical ask.
Once authorised, the tools exist A regional authority may issue revenue bonds and, with voter approval, levy a dedicated local sales and use tax. This system cooperates with Valley Regional Transit — feeder integration, shared stations, coordinated service — without subordinating its governance design to it.
09 · Open contracting
Honolulu's fully-elevated rail reached about $525 million a mile. Sacramento built a 100%-elevated extension below the national median. Same physics, different books — which is why open contracting is a cost strategy here and not only an ethics one.
Explainer 10
A megaproject is where a contracting firewall earns its keep.
Loading the contracting gate…
10 · Sources and method
The map, the models, and the formal document use the same data and calculation layer. Every file below is the one the page actually reads.
boardings = walkRate × residents within half a mile + ringRate × residents between half a mile and two miles. The two rates are not chosen. They are fitted by least squares through the origin, with both coefficients held non-negative, to a real operating system — Utah Transit Authority rail — whose station catchments were measured by the same code, from the same Census layer, at the same two radii. FrontRunner is the default comparison because it is the same architecture: one regional line beside an interstate, between separate cities, reached mostly by car. You can switch the comparison to TRAX or to both systems pooled, and the fitted rates and the goodness of fit change on screen with it.Corridor data built July 24, 2026. Where this page states something the proposal has not proved, it is labelled Stated. Where the proposal's own numbers do not reconcile against real geometry, the page says so and shows the arithmetic. You are not asked to trust any of it. You are asked to check it.
Build the spine
Secure the Chapter 21 amendment authorising a regional rail authority. Charter the interjurisdictional board. Run the pilot bus routes that turn projected demand into measured demand. Publish every receipt.
Build thisCheck the work first. Then help build it.